Task reports (v1)
Task reports show you how the tasks on your account are performing.
There are two types of task reports:
Status
Time to completion
To view a report, go to the tab, select , and select the report you want to see.
To learn more about tasks, see About Maxsight's tasks.
By default, all reports show data for profiles who are prospects and/or customers. To view the data for company associates, change the options for the Profile type filter criterion.
To learn more about when your data refreshes, and how data is displayed in the graph and table, see About reports (v1).
Status report
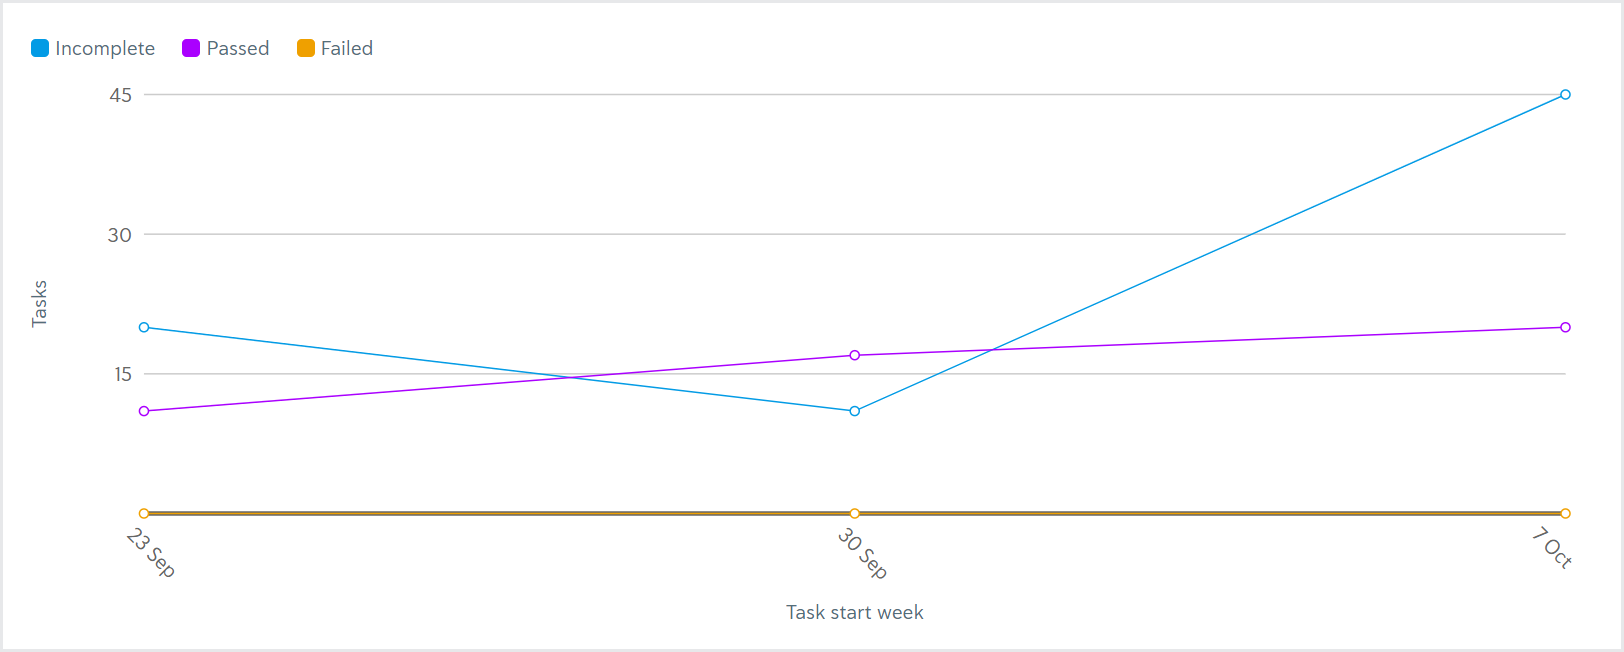
The Status report shows you how many tasks created each week have an Incomplete, Passed, or Failed status.
There are three metrics:
Incomplete: The number of tasks created that week that currently have an Incomplete status.
Passed: The number of tasks created that week that currently have a Passed status.
Failed: The number of tasks created that week that currently have a Failed status.


In this example, 31 tasks were created the week of September 23. Of those 31 tasks, 20 are currently Incomplete, 11 are Passed, and 0 are Failed.
This report shows task versions. For example, if a task is added to an application and then a new version of that task is added later, the Status report shows two separate tasks.
Time to completion report
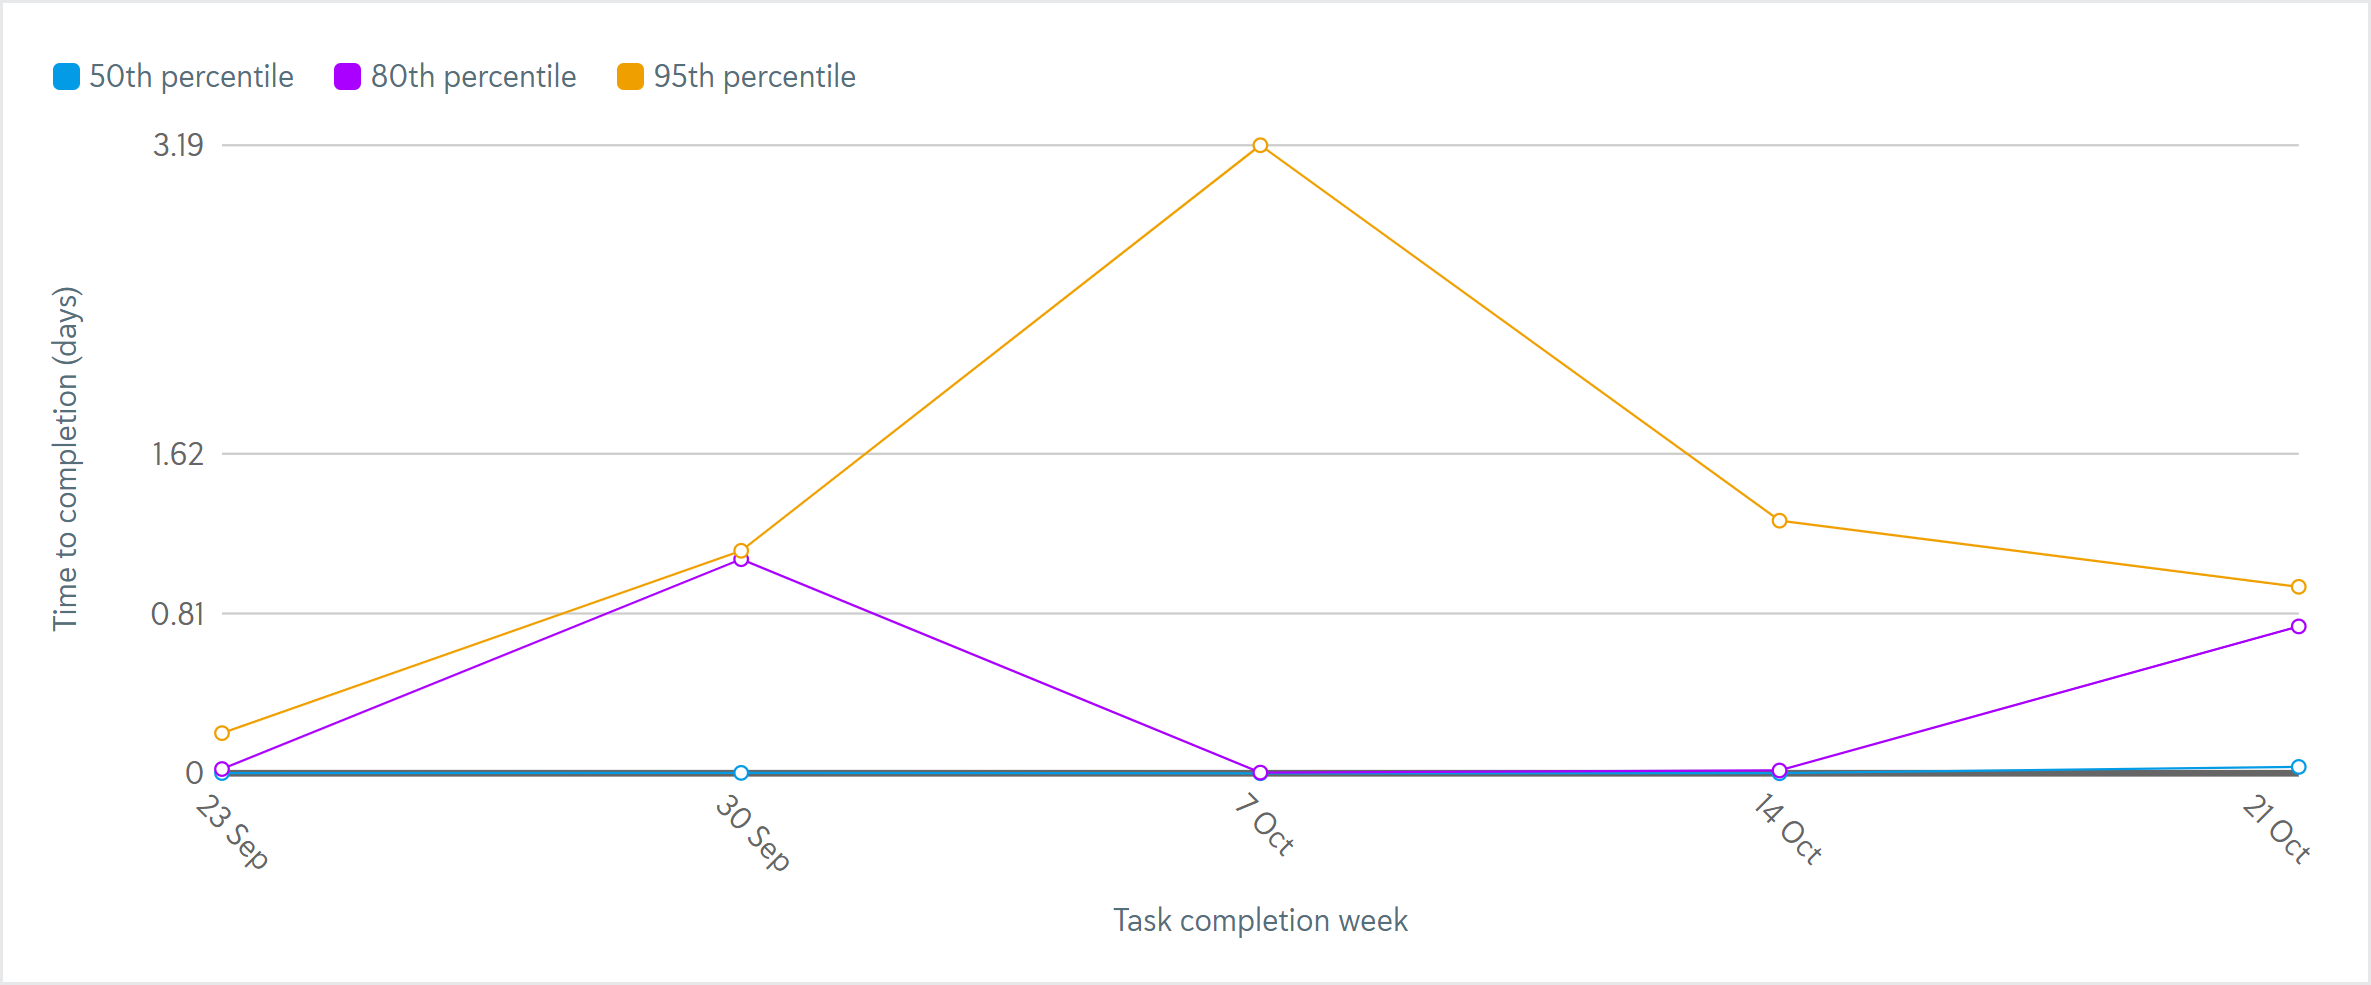
Time to completion reports show how long it took for a percentile of tasks to be completed, either passed or failed, each week.
There are three metrics:
50th percentile: The amount of time it took for 50% of the tasks passed/failed that week to be completed.
80th percentile: The amount of time it took for 80% of the tasks passed/failed that week to be completed.
95th percentile: The amount of time it took for 95% of the tasks passed/failed that week to be completed.


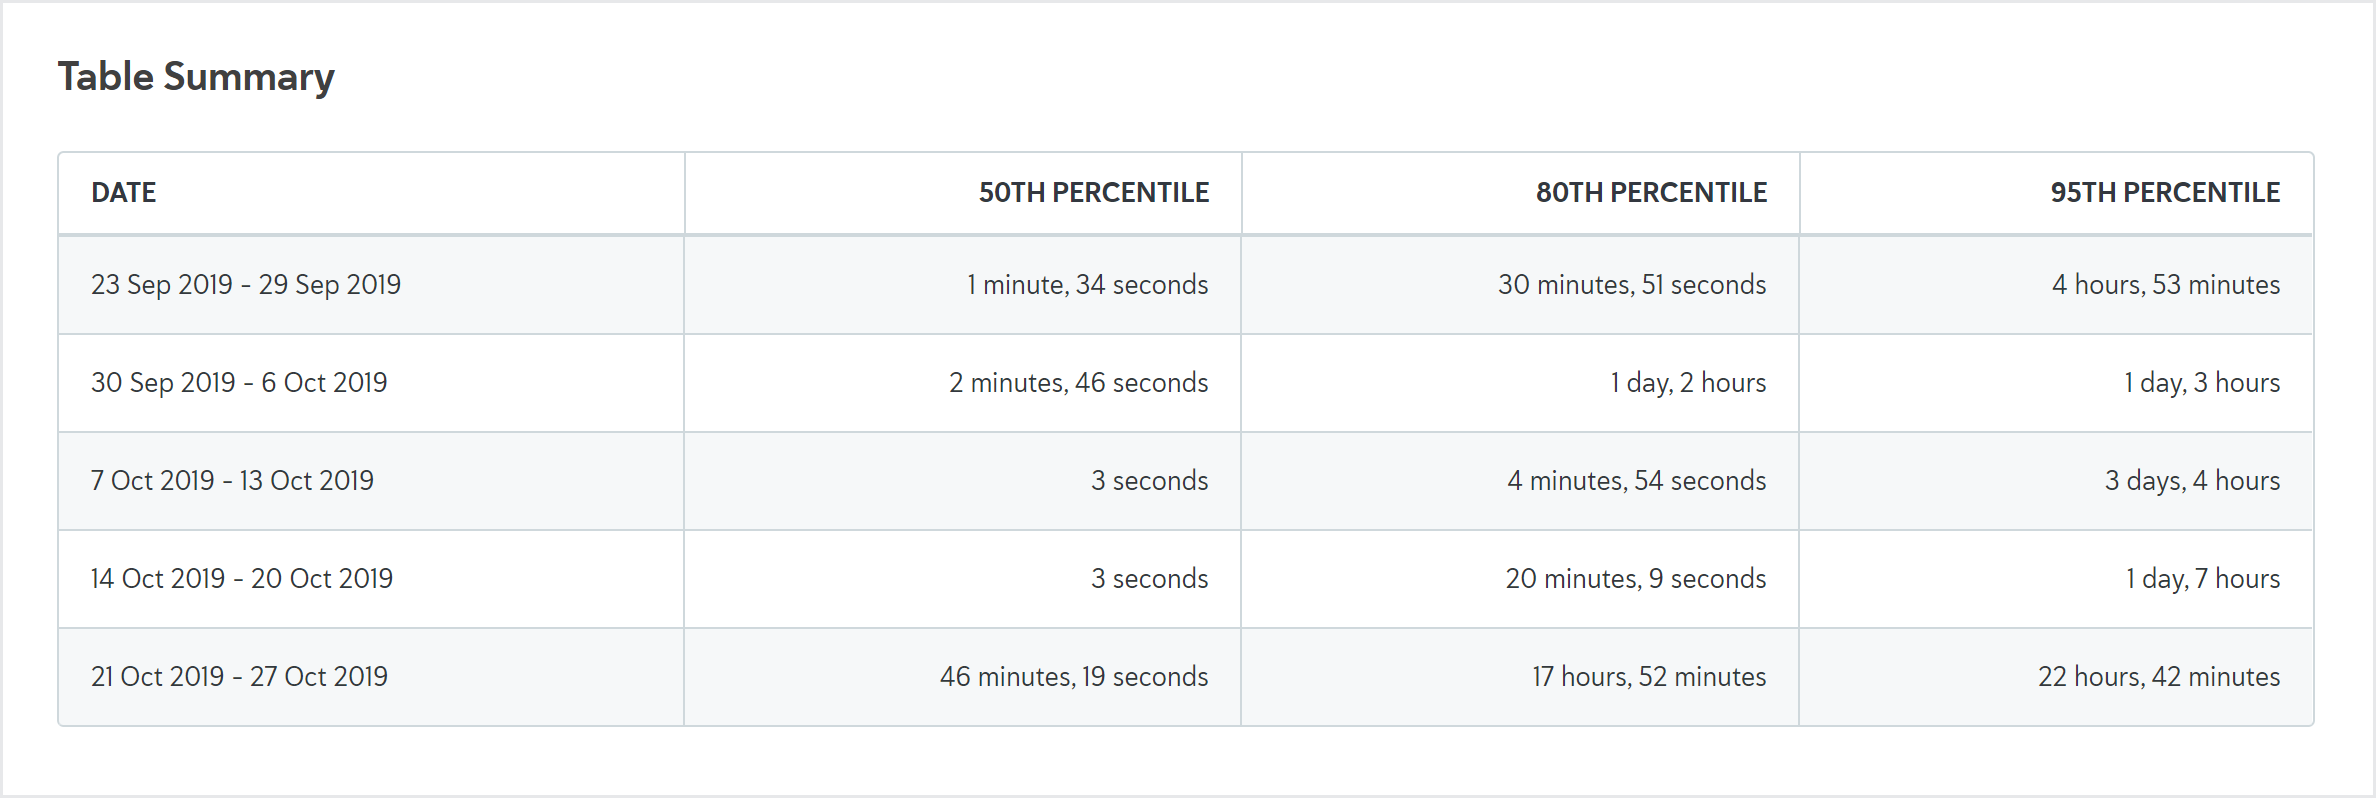
In this example, 50% of tasks that passed/failed the week of September 23 were decided in 1 minute and 34 seconds or less. 80% of tasks that passed/failed that week were decided in 30 minutes and 51 seconds or less. 95% of tasks that passed/failed that week were decided in 4 hours and 53 minutes or less.
This report shows task versions. For example, if a task is added to an application, then a new version of that task is added later, the report shows two separate tasks.
This report shows the time it took for each task version to be completed the first time. For example, if a task version was initially failed, then later passed, the Time to decision report only shows the amount of time before the task version failed. If the task then gets a second version, that version is tracked as a separate task.
If the table shows 0 seconds, this means either the result was returned in less than 1 second or there's no data for the plot point, for example, when you've grouped by Task name and no tasks with that name were completed that week.